When you're staring at a potential commercial real estate deal, how do you separate a genuine opportunity from a money pit? You run the numbers. A commercial property ROI calculator is the tool that lets you do just that, translating a spreadsheet full of figures into a clear, concise story about profitability.
It's designed to take all the key variables—purchase price, renovation costs, projected rent, and operating expenses—and distill them into the metrics that actually matter. This isn't just about number-crunching; it's about gaining a precise understanding of an asset's financial health before you ever sign a contract.
What a Commercial Property ROI Calculator Really Tells You
Think of an ROI calculator less like a simple machine and more like your financial co-pilot for an investment. It’s built to cut through the noise and ambiguity that often surrounds real estate deals. Gut feelings have their place, but this tool ensures your final decision is anchored in solid, verifiable data.
Ultimately, its job is to paint a clear picture of an investment’s viability before you commit a single dollar. It creates a standardized framework, allowing you to compare vastly different properties on an even playing field. Whether it’s a modern office building or a historic warehouse you plan to convert, a good calculation provides the clarity you need to move forward with confidence.
The Inputs Your Analysis Depends On
There's an old saying in data analysis: garbage in, garbage out. It couldn't be more true here. The accuracy of your ROI forecast is only as good as the numbers you put into it.
To get a realistic projection, you'll need to gather some key data points:
- Purchase Price: This is the all-in acquisition cost of the property.
- Renovation & Upfit Costs: Your budget for any construction, major repairs, or tenant improvements.
- Projected Rental Income: Be realistic here. What can you genuinely expect for gross annual rent?
- Operating Expenses: Think property taxes, insurance, maintenance, and property management fees.
- Financing Details: If you're using debt, you'll need the loan amount, interest rate, and term.
Pulling this together takes some real legwork. You'll be researching comparable market rents, getting firm quotes from contractors, and digging into local tax assessments. This initial diligence is the foundation of a trustworthy ROI calculation. While we're focused on commercial deals here, a general real estate ROI calculator can provide a broader context for how these tools work across different property types.
The Outputs That Drive Your Decisions
With your inputs loaded, the calculator gets to work and delivers the metrics that professional investors live and breathe by. These outputs are the language of commercial real estate and will form the core of your investment strategy.
Here’s a quick look at the kind of data you can expect to see.
Before we dive into the details of each metric, here's a quick cheat sheet to keep the key players straight. This table summarizes the core ROI metrics we'll be exploring, what they measure, and why they are so critical for making smart investment choices.
Key ROI Metrics at a Glance
| Metric | What It Measures | Why It Matters for Your Decision |
|---|---|---|
| NOI | A property's income after operating expenses but before debt service or taxes. | It shows the raw profitability of the asset itself, independent of financing. |
| Cap Rate | The rate of return based on the income a property is expected to generate. | It's a quick way to compare the relative value of similar properties in the same market. |
| Cash-on-Cash | The annual pre-tax cash flow relative to the total cash invested. | This tells you the direct return on your out-of-pocket capital, which is crucial when using leverage. |
| IRR (Internal Rate of Return) | The annualized rate of return on an investment over its entire holding period. | It accounts for the time value of money, making it a sophisticated metric for long-term projects. |
| NPV (Net Present Value) | The difference between the present value of cash inflows and outflows. | It helps determine if an investment will be profitable by translating future returns into today's dollars. |
These metrics aren't just static numbers; they're tools for dynamic analysis. They let you stress-test your assumptions and model different outcomes. What happens to your returns if vacancy hits 10% instead of the projected 5%? How much does an unexpected $50,000 in renovation costs eat into your cash-on-cash return? A good calculator helps you answer these "what-if" questions in seconds.
For example, say you buy a tired commercial building for $1 million. You put $300,000 into a full renovation, and five years later, it appraises for $2 million. Using a simple cost-based calculation, your ROI would be a very attractive 53.8%—a figure that helps justify the upfront risk and effort.
A great investment is born from great analysis. A commercial property ROI calculator doesn't make the decision for you, but it provides the critical intelligence needed to make the right decision. It illuminates risks, highlights opportunities, and grounds your strategy in financial reality.
Getting to Grips with the Core ROI Metrics
To really get a feel for an investment's potential, you need to speak its language. The numbers a good commercial property ROI calculator spits out aren't just figures; they're the vocabulary of professional real estate. They take you way beyond a simple "profit vs. loss" view and reveal the true financial pulse of a property.
Let's walk through the essential formulas that drive any serious investment analysis. To keep things grounded, we'll use a single, consistent example: a hypothetical $2,000,000 office building you're thinking about buying.
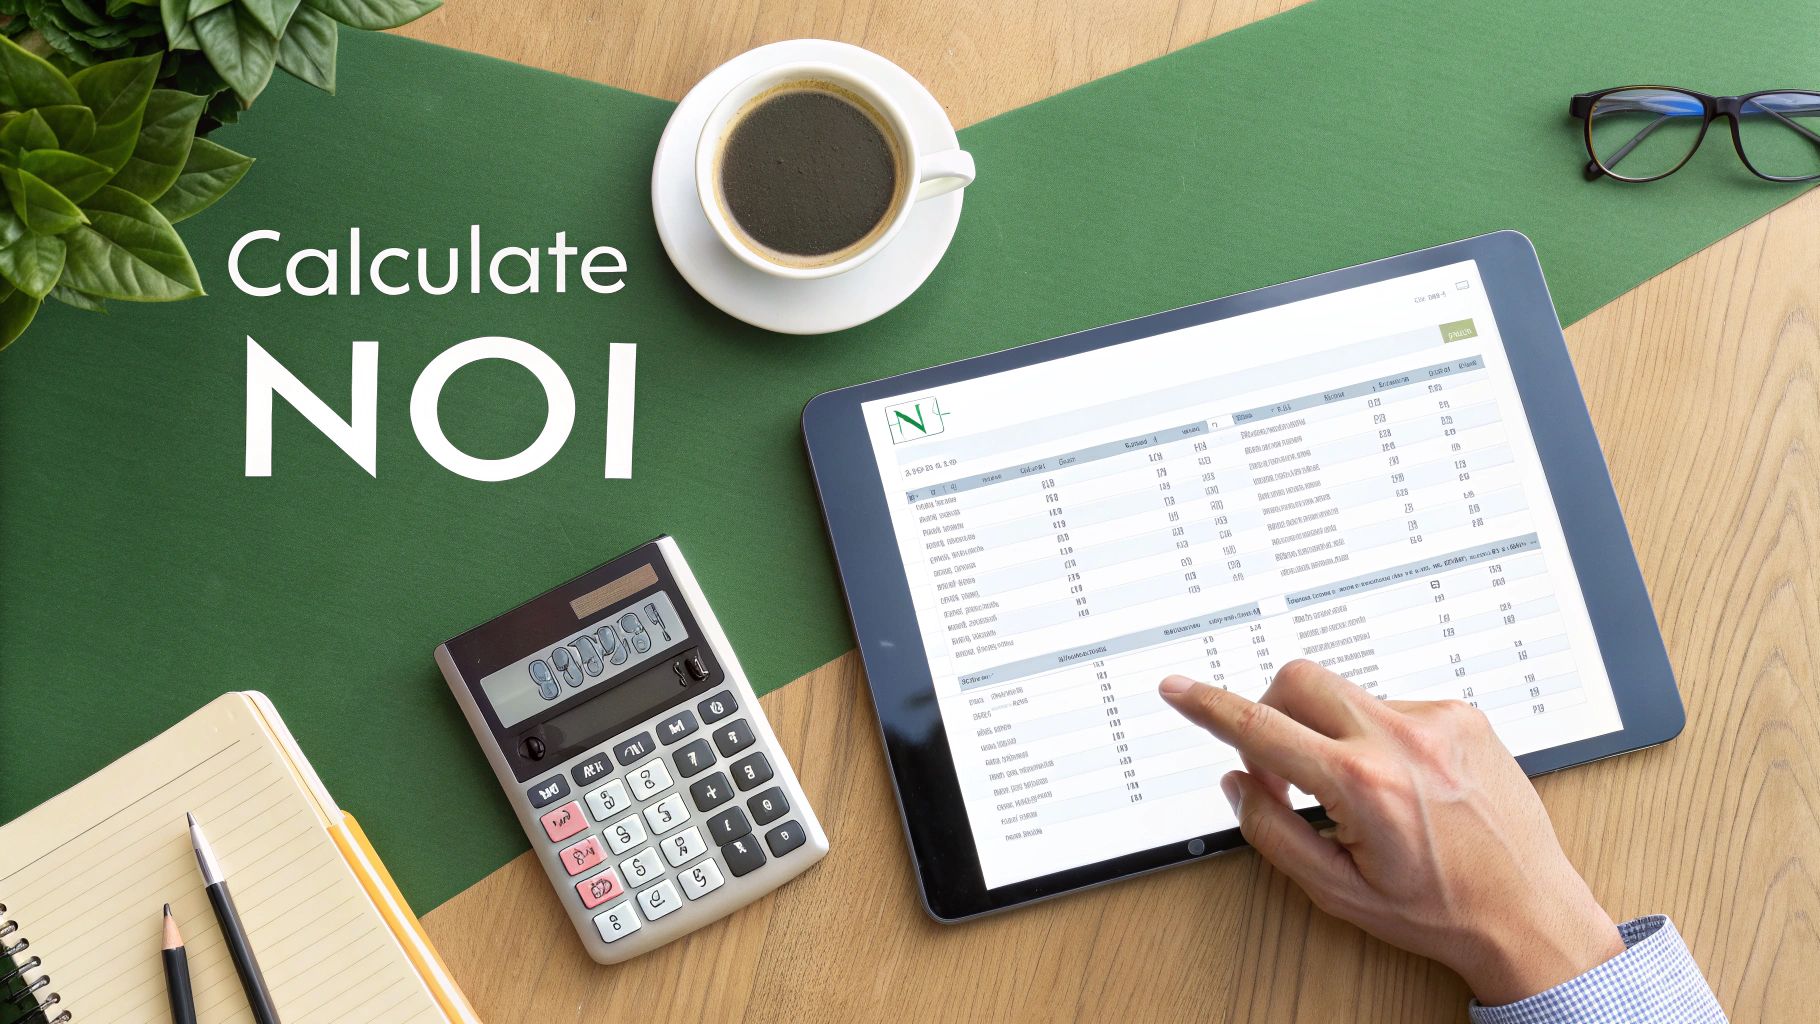
The Foundation: Net Operating Income (NOI)
Before you even start thinking about your mortgage or taxes, you have to answer one critical question: does this property actually make money on its own? That's exactly what Net Operating Income (NOI) tells you. Think of it as the purest measure of a property's cash-generating power, completely separate from how you choose to finance it.
The formula itself is pretty straightforward:
NOI = Gross Operating Income (GOI) – Operating Expenses
Gross Operating Income is all the rent you could possibly collect, minus what you realistically lose to empty units or tenants who don't pay. Your operating expenses are everything it takes to keep the lights on and the building running—property taxes, insurance, maintenance, management fees, you name it.
What’s crucial here is what’s not included: your loan payments (debt service), depreciation, and income taxes. Those are about your financial situation, not the building's intrinsic performance.
Let's plug in the numbers for our $2,000,000 office building:
- Gross Potential Rent: $220,000/year
- Vacancy Allowance (a realistic 5%): -$11,000
- Gross Operating Income (GOI): $209,000
- Total Operating Expenses: -$75,000
- Net Operating Income (NOI): $134,000
This $134,000 is the engine of your investment. It's the raw cash the property generates all by itself.
The Market Benchmark: Capitalization Rate (Cap Rate)
Once you've got your NOI, you can quickly figure out the Capitalization Rate, or Cap Rate. In the world of commercial real estate, this is one of the most common metrics for a quick side-by-side comparison of similar properties in the same market.
It essentially shows you the rate of return you'd get if you bought the property with all cash.
Here's the calculation:
Cap Rate = Net Operating Income (NOI) / Current Market Value (or Purchase Price)
Using our example:
$134,000 (NOI) / $2,000,000 (Purchase Price) = 0.067 or 6.7%
Our building has a Cap Rate of 6.7%. Now, that number means nothing on its own. Its real power is in comparison. If similar office buildings down the street are selling at a 5.5% cap rate, this deal might be a bargain. But if they're trading at an 8% cap rate, it could be a red flag that you're about to overpay.
Pro Tip: Think of the Cap Rate as your market barometer. A lower cap rate often points to a lower-risk, higher-value asset in a prime location. A higher cap rate might signal more risk, more required management, or a less desirable property.
Your Actual Return: Cash-on-Cash
Let's be real—most investors aren't buying a $2,000,000 building with a briefcase full of cash. They're using a loan, or leverage. That's why the Cash-on-Cash Return is so vital. It hones in on the return you're getting on the actual money you've pulled out of your own pocket. It's the ultimate gauge of how well your financing is working for you.
Here’s how you figure it out:
Cash-on-Cash Return = Annual Pre-Tax Cash Flow / Total Cash Invested
First, we need that Annual Pre-Tax Cash Flow. It's simply your NOI minus your total mortgage payments for the year (your debt service).
Sticking with our example, let's say you put down $500,000 (your total cash invested) and your annual mortgage payments come to $90,000:
- Net Operating Income (NOI): $134,000
- Annual Debt Service: -$90,000
- Annual Pre-Tax Cash Flow: $44,000
Now we can calculate your Cash-on-Cash Return:
$44,000 / $500,000 = 0.088 or 8.8%
Your Cash-on-Cash Return is 8.8%. This tells you that for every single dollar you personally invested in this deal, you're getting almost nine cents back each year before taxes. It’s a direct reflection of how your money is performing, not just how the building is performing.
The Big Picture: Internal Rate of Return (IRR)
The metrics we've covered so far are great snapshots of a single year. But what about the entire life of the investment, from the day you buy it to the day you sell it? That’s where the Internal Rate of Return (IRR) steps in.
IRR is a more sophisticated metric that calculates your total annualized return over the entire holding period. Its secret weapon is that it accounts for the time value of money—the fundamental idea that a dollar in your hand today is worth more than a dollar you expect to get next year.
You won't find a simple pen-and-paper formula for IRR; it's the kind of thing you solve for using a financial calculator or a spreadsheet program like Excel. It essentially works backward to find the discount rate that would make the net present value (NPV) of all your cash flows—your initial investment, the annual cash flows, and the final payout from the sale—add up to zero.
While the math gets a little heavy, the concept is simple. IRR boils down your entire investment journey into a single percentage. This makes it an incredibly powerful tool for comparing totally different projects, especially those with unique timelines and irregular cash flow.
Putting the ROI Calculator to Work on Real Projects
Theory is one thing, but the real power of these metrics comes to life when you start plugging in numbers from actual deals. This is where an ROI calculator stops being a textbook exercise and becomes your guide for navigating risk, spotting opportunities, and mapping out your potential profit.
But before you can model anything, you have to get your hands dirty and gather the foundational data. This isn't about pulling rough estimates from a quick online search. We're talking about sourcing accurate, defensible figures for every key variable, because the quality of what you put in absolutely dictates the reliability of what you get out. Think of this initial due diligence as non-negotiable.
Your starting data checklist should always include:
- Total Acquisition Cost: This is the purchase price, of course, but don't forget to add all the associated closing costs—things like legal fees, title insurance, and appraisal fees add up.
- Renovation and Upfit Budget: Get detailed, quote-based estimates for all the work you have planned. This covers everything from major structural changes to the cosmetic touches needed for a specific tenant.
- Projected Operating Expenses: Be realistic. Your annual costs for property taxes, insurance, maintenance, utilities, and management need to be grounded in reality. The best way to do this is to pull data from comparable properties in the area.
This whole process is about building a clear financial picture, piece by piece.
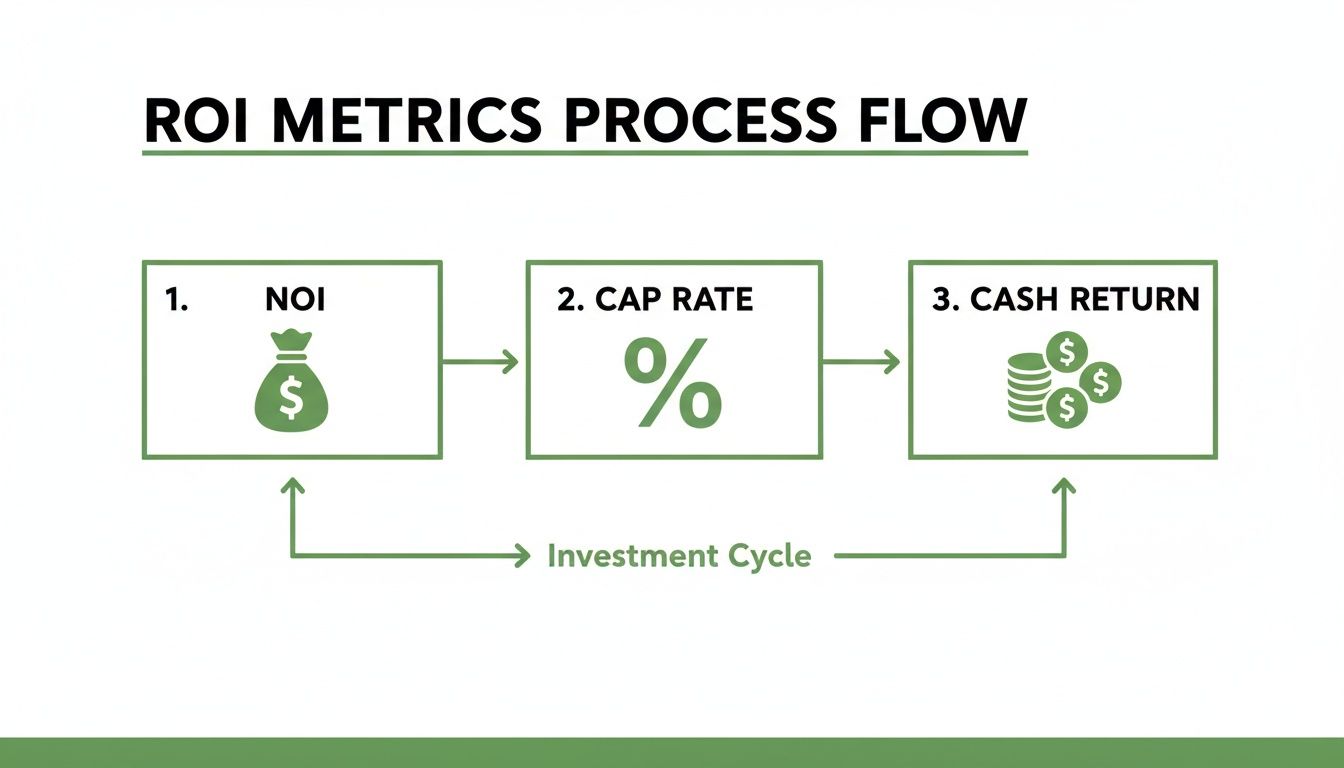
As you can see, each metric really just builds on the one before it. You start with income, factor in costs, and end up with a progressively sharper view of an asset's true financial performance.
Comparing Investment Scenarios
To really see how a commercial property ROI calculator flexes its muscles, let's compare two completely different strategies for the same urban site: building a brand-new property from the ground up versus an adaptive reuse of a historic building that's already there. Each path comes with its own unique set of costs, timelines, and potential returns that a good calculator can lay bare.
By modeling different scenarios, you turn your ROI calculator from a simple number-cruncher into a powerful strategic tool. It lets you pressure-test your own assumptions and find the most profitable path forward before a single dollar is committed.
Financing, for example, can dramatically change the outcome. Take a real-world case of a Toronto rental property bought with a $109,000 down payment. It generated $12,792 in gross annual rent. After accounting for $4,000 in expenses, the NOI landed at $8,792, giving the investor a first-year ROI of 8.07%. But the story doesn't end there. As the mortgage gets paid down, the ROI is projected to hit 10-12% within just five years. It's a perfect illustration of how leverage can amplify your returns over time. You can see how different financing structures play out by using a good rental property calculator.
Scenario Comparison: New Build vs. Adaptive Reuse
Let's dig into the financials for our two hypothetical projects. For this exercise, we'll assume both are targeting a 20,000 square foot mixed-use commercial space. They're on the exact same piece of land, which was purchased for $1,000,000.
| Financial Factor | New Construction Scenario | Adaptive Reuse Scenario |
|---|---|---|
| Initial Investment | Land: $1,000,000 Hard Costs: $4,000,000 Soft Costs: $600,000 Total: $5,600,000 |
Land/Building: $1,000,000 Hard Costs: $2,500,000 Soft Costs: $375,000 Total: $3,875,000 |
| Financing (25% Down) | Down Payment: $1,400,000 | Down Payment: $968,750 |
| Project Timeline | 18-24 months | 12-16 months |
| Gross Potential Rent | $500,000 / year | $450,000 / year (lower due to layout constraints) |
| Operating Expenses | $150,000 / year (lower due to new systems) | $165,000 / year (higher due to older infrastructure) |
| Special Incentives | None | 20% Federal Historic Tax Credit on qualified expenses ($500,000) |
The table lays out the raw numbers, but the story is in how they interact to produce a final return. The new build looks clean and predictable, while the adaptive reuse has some compelling financial quirks.
Analyzing the New Construction ROI
For the new build, the math is pretty straightforward. You're building a modern property with brand-new systems, which means you can command higher rents and expect lower maintenance costs. That all adds up to a strong NOI.
- Net Operating Income (NOI): $500,000 (Rent) – $150,000 (Expenses) = $350,000
- Cap Rate: $350,000 / $5,600,000 = 6.25%
- Annual Debt Service (est.): $252,000
- Annual Cash Flow: $350,000 – $252,000 = $98,000
- Cash-on-Cash Return: $98,000 / $1,400,000 (Down Payment) = 7.0%
A 7.0% cash-on-cash return is solid and dependable for a new Class A asset. The trade-off for that stability is a much higher initial investment and a longer timeline where your capital is tied up before it starts earning.
Unpacking the Adaptive Reuse ROI
Now, let's look at the adaptive reuse project. The numbers here tell a more complex, but potentially far more rewarding, story. The upfront investment is significantly lower, and you'll get to cash flow much faster. While the gross rent is a little lower and operating costs are a bit higher, there’s a massive financial incentive that changes the entire game.
- Net Operating Income (NOI): $450,000 (Rent) – $165,000 (Expenses) = $285,000
- Cap Rate: $285,000 / $3,875,000 = 7.35%
Right off the bat, that higher cap rate suggests you're getting a better value relative to the cost. But the real magic happens when you factor in the Historic Tax Credit.
That $500,000 tax credit isn't just a paper deduction; it directly reduces the amount of cash you need to bring to the table. Instead of a $968,750 down payment, your effective out-of-pocket investment drops to just $468,750. This has a colossal impact on your return.
- Annual Debt Service (est.): $174,375
- Annual Cash Flow: $285,000 – $174,375 = $110,625
- Cash-on-Cash Return: $110,625 / $468,750 (Effective Equity) = 23.6%
The difference is staggering. Even though it generates less cash flow in absolute dollars, the adaptive reuse project delivers a cash-on-cash return more than three times higher than the new build. This is the kind of insight that a detailed, side-by-side analysis gives you. It proves that the most obvious path isn't always the most profitable one and shows how creative strategies and incentives can produce truly outstanding returns.
How Smart Design Choices Can Supercharge Your Returns
The numbers that pop out of a commercial property roi calculator aren't just theoretical. They’re a direct reflection of real-world decisions about a building's design, its materials, and the systems that make it run. An investment’s profitability isn’t set in stone; you can actively shape it with strategic architectural choices that boost value and slash long-term costs.
This is where the spreadsheet meets the stud wall. Smart design is far more than just making a place look good—it's one of the most powerful financial levers you can pull. By focusing on elements that improve efficiency and unlock incentives, you can directly tweak the inputs of your ROI calculation for a much more attractive outcome.
Driving Down Expenses with Energy Efficiency
One of the most direct ways to fatten up your Net Operating Income (NOI) is to relentlessly attack your operating expenses. Utility bills are a constant, significant drain on any commercial property, but they’re also one of the most manageable if you get the design right from the start.
Investing in energy efficiency pays you back for the entire life of the property. And I’m not just talking about swapping out a few light bulbs. This is about a whole-building approach to performance.
- High-Performance HVAC Systems: Modern, efficient heating and cooling systems can make a massive dent in your monthly utility spend.
- A Tighter Building Envelope: Think of superior insulation and sealing as wrapping your investment in a warm blanket. It stops energy from leaking out, so your HVAC system doesn't have to work nearly as hard.
- Strategic Daylighting: Designing spaces to pull in as much natural light as possible cuts down on the need for artificial lighting, which is a constant drain on electricity.
- Solar Integration: The upfront cost is real, but commercial solar can wipe out a huge chunk of your energy expenses. A typical system costs between $1.00 and $2.50 per watt before you even factor in incentives.
Remember, every single dollar you save on utilities is a dollar added straight to your NOI. That not only improves your annual cash flow but also directly increases the building’s market value.
A building designed for peak energy performance is fundamentally a more profitable asset. It commands higher tenant satisfaction, boasts lower operating costs, and holds its value better over time, making it a clear winner in any ROI analysis.
The Financial Power of Historic Preservation
If you're looking at older properties, historic preservation offers one of the most powerful financial tools in the entire game: historic tax credits. These aren't just minor deductions. They are game-changing incentives that can completely reshape the economics of an adaptive reuse project, turning a borderline deal into a home run.
Take the Federal Historic Preservation Tax Incentives program. It gives you a 20% income tax credit for the qualified rehabilitation costs of a certified historic building. That credit is a dollar-for-dollar reduction of your tax bill, which dramatically cuts the amount of your own capital tied up in the project.
The ripple effect on your ROI is huge. For a project with $1 million in qualified rehab expenses, you’d get a $200,000 tax credit. That cash infusion effectively lowers your equity contribution and can juice your final cash-on-cash return by as much as 25%.
We're seeing a similar trend in Europe, where new energy mandates are pushing investors to retrofit historic assets. Those updated properties are showing returns of 11% compared to just 7% for their unoptimized counterparts. Expertly navigating complex building codes is also key—doing it right can save 5-10% of potential yield that would otherwise get eaten up by delays. You can dig deeper into how these financial strategies work with expert guidance in this analysis of commercial property ROI.
By using these credits, you turn a building's history from a potential headache into a massive financial asset. It’s a perfect example of how knowing the rules and incentives can turn the dials on your ROI calculator firmly in your favor.
Avoiding Common Mistakes in Your ROI Analysis
Even the most sophisticated commercial property roi calculator is only as good as the numbers you plug into it. Let's be blunt: an overly optimistic projection isn't just a simple miscalculation—it's a direct route to a disastrous investment. I’ve seen it happen. The most critical part of any analysis is stress-testing every single assumption you make.
This is where you have to separate wishful thinking from verifiable reality. The single biggest mistake I see investors make is taking a rosy view of future income and expenses. It leads to a beautifully inflated ROI on paper that will never, ever show up in your bank account.
Overly Optimistic Projections
It's surprisingly easy to fall into the trap of assuming a 100% occupancy rate. Or maybe you underestimate how long it will take to find tenants for a vacant space. Markets shift, tenants move on, and securing the right replacement always takes time. A realistic vacancy allowance, usually somewhere between 5% and 10%, isn't just a suggestion; it’s an absolute necessity for an accurate forecast.
Likewise, it's tempting to project aggressive rent growth right out of the gate. While we all hope for strong appreciation, your initial analysis must be firmly planted in current, verifiable market rates.
Don't confuse your investment goals with your market analysis. Your projections should reflect what the market is, not what you hope it will become. Ground your numbers in comparable property data, not aspirations.
Another danger zone is the renovation budget. Assuming timelines and costs will go exactly as planned is a rookie move. Delays are inevitable, and unexpected problems always surface once you start opening up walls. Building a contingency fund of 10-15% into your renovation budget isn't pessimism; it's professionalism.
Ignoring Hidden and Future Costs
A truly professional ROI analysis peers beyond the immediate, obvious expenses. It meticulously accounts for the big-ticket, infrequent costs—often called capital expenditures, or CapEx—that can ambush an unprepared owner years down the road.
If you forget to budget for these future costs, your cash flow will look deceptively healthy.
- Roof Replacement: Every commercial roof has a finite lifespan. You have to set aside funds annually for the day it needs to be replaced.
- HVAC Systems: These are complex, costly systems. Eventually, they will demand major repairs or a full replacement.
- Parking Lot Repaving: Over time, asphalt breaks down. Resurfacing it requires a significant capital outlay.
- Major System Upgrades: Think about the big stuff in an older building—elevators, plumbing, or electrical systems that will eventually need a complete overhaul.
Failing to account for these items means you're effectively overstating your property's profitability every single year. A proper analysis always includes a "replacement reserve" in the operating expenses, which ensures you’re building that financial cushion for these certainties. While the specifics differ, learning about the common pitfalls of online short-term rental calculators can offer valuable lessons. The core principle is universal: you have to scrutinize your inputs and understand the limitations of any tool you use.
Your Top Commercial Property ROI Questions, Answered
Even with the best tools, you're going to have questions when you're deep in the numbers on a potential deal. It's just part of the process. Below, I’ve tackled some of the most common questions investors ask when they’re trying to make sense of a property's real potential.
Think of this as a quick reference to clear up those nagging uncertainties that pop up right when you're trying to decide whether to move forward.
What Is a Good ROI for a Commercial Property?
This is the million-dollar question, isn't it? The honest answer is, "it depends." There’s no single number that works everywhere, for every building. It all comes down to the market, the property type, and how much risk you're willing to take on.
That said, a good rule of thumb for a stable, low-risk commercial property is a cash-on-cash return in the 8-12% range. But if you’re looking at something riskier—say, a major value-add project or building from the ground up—you need to aim much higher. For those deals, you should be targeting an ROI of 15-20% or even more to make the extra risk and headache worthwhile. The key is to compare apples to apples with similar local investments.
How Does Financing Affect My ROI Calculation?
Financing completely changes the game. It’s the lever that can turn a decent deal into a fantastic one. By using a loan, you reduce your upfront cash investment, which can send your cash-on-cash return through the roof.
Of course, there's no free lunch. A loan means a mortgage payment, which eats into your monthly cash flow. This is exactly why a good commercial property ROI calculator is non-negotiable. It lets you play with different loan scenarios—adjusting interest rates, loan amounts, and payment schedules—to see precisely how financing impacts your bottom line before you sign on the dotted line.
Your financing structure is one of the most powerful levers you can pull to optimize an investment. Using a calculator to compare different debt options isn't just good practice; it's a critical step in maximizing your financial outcome.
How Often Should I Recalculate My Property ROI?
Your initial analysis is just the starting line. You should be re-running the numbers on your property at least once a year. This keeps you honest about its actual performance and shows you how changes in rent, expenses, or market conditions are affecting your investment.
It's also crucial to recalculate ROI after any major event. Did you just put on a new roof? Sign a big, long-term lease? Refinance your loan? Each of these events changes the financial picture. Staying on top of your numbers means you’re always making decisions based on what’s happening now, not what you hoped would happen a year ago.
Can I Use a Simple ROI Calculator for an Adaptive Reuse Project?
A simple calculator is fine for a quick, back-of-the-napkin look, but for something as complex as an adaptive reuse project, it just won’t cut it. These deals are a different beast entirely. They come with unpredictable renovation costs, long construction timelines, and unique financial incentives that a basic tool simply isn't built to handle.
For example, incentives like the 20% Federal Historic Tax Credit can fundamentally change the economics of a project, making a seemingly impossible deal incredibly profitable. To get a real sense of an adaptive reuse project's potential, you need a more sophisticated calculator or a custom spreadsheet that can account for these high-impact variables.
At Sherer Architects, LLC, we specialize in turning complex commercial, adaptive reuse, and historic preservation projects into profitable realities. Our expertise in design, navigating tax credits, and optimizing building performance ensures your investment is sound from blueprint to bottom line. Let's build something enduring together. https://shererarch.com